

You are using an out of date browser. It may not display this or other websites correctly.
You should upgrade or use an alternative browser.
You should upgrade or use an alternative browser.
$10 million for WNBA champs to play a boy's high school team
- Thread starter T. A. Gardner
- Start date
It is social commentary. It is being hyped by media and the Left as something great and on par with the NBA when it actually attracts a small fraction of spectators and fans that the NBA does.
A typical WNBA game plays at an arena with a 10,000 to 15,000 draw, at most and for most games draws 5 to 7 thousand.
A typical NBA game draws a crowd of 15 to 30,000 with a typical game drawing 18,000.
So, even with lots of hype the WNBA is drawing roughly half what the NBA does.
p.s. Both the Dallas Wings and Washington Mystics are presently but probably just for this year confined in smaller arenas. The Mystics sell out for every game.
Last edited:
WNBA Attendance - Across the Timeline
WNBA regular-season average attendance rose modestly for much of the past decade, crashed during COVID restrictions, then surged sharply from 2023–2025 (and into 2026), while the league ran consistent operating losses for nearly its entire history until reportedly crossing into limited profitability territory around 2025. Exact audited annual P&L figures are not publicly released in full, so loss estimates rely on commissioner statements, reporting from outlets like The Washington Post, and secondary analyses.
Attendance (regular-season average per game)
Reliable compilations (Across the Timeline, Number Tamer/official reports, Sports Business Journal, Statista) show this approximate timeline:
| Year | Avg. Attendance | Notes |
|---|---|---|
| 2015 | ~7,318 | Near multi-year low |
| 2016 | 7,655 | |
| 2017 | 7,716 / 7,713 | |
| 2018 | ~6,770–6,779 | Decline partly tied to venue moves (e.g., Liberty) |
| 2019 | 6,528 | |
| 2020 | N/A (0) | Bubble season, no fans |
| 2021 | ~2,620–2,651 | Capacity limits/restrictions |
| 2022 | ~5,571–5,646 | Partial rebound |
| 2023 | 6,615 | Recovered to pre-pandemic range |
| 2024 | 9,807 | +48% YoY; highest since late 1990s in some rankings; strong Fever/Clark effect and more games in larger venues |
| 2025 | ~10,986–11,148 | Record or near-record high (league expanded to 13 teams with Golden State Valkyries averaging ~18k); total attendance also hit new highs |
| 2026 (partial) | ~11,230 (early data) | Continued elevated levels |
Pre-2024 averages largely hovered in the mid-to-high 6,000s to low 7,000s after the league’s early years (late-1990s peaks near or above 10k). The 2024–2025 jump was broad-based but heavily driven by star power (especially Caitlin Clark and the Indiana Fever), bigger venues for select games, expansion, and rising interest. Total fans through the gates roughly doubled from 2022 levels into the mid-2 millions by 2024 and higher in 2025.
Financial losses / profitability
- Long-term pattern: The league has operated at a net loss for nearly its entire existence since 1997. NBA Commissioner Adam Silver stated in 2018 that it lost more than $10 million per year on average (implying cumulative losses of roughly $210+ million by then). Multiple reports put cumulative losses in the hundreds of millions (often cited around $280M+ through the mid-2020s), with ongoing NBA subsidies and ownership support.
- Recent years: Losses continued in the ~$10M range in many pre-2024 seasons amid revenue growth (from ~$100M range around 2019 to ~$200M+ by 2023–2024). 2024 saw larger reported losses of ~$40–50 million despite the attendance/TV boom (factors cited include higher costs such as charter travel). Some individual teams have been profitable in isolated years (e.g., reports of a few cash-flow positive clubs earlier in the 2010s and more recently).
- 2025 shift: The league generated enough to trigger revenue sharing under the prior CBA for the first time (~$16M total shareable after thresholds/expenses, with ~$8M going to players). Revenue estimates rose further (team-level figures and league totals cited in the $300M–$410M range in various analyses). Franchise valuations exploded (average team values jumping dramatically; expansion fees in the high tens to hundreds of millions). A new media deal (reported ~$2.2B over 11 years starting around 2026) and higher local revenues support optimism about sustained profitability, though the new CBA (higher salary cap, larger player share) increases costs. Full audited net figures remain private.
In short, attendance was stagnant-to-declining for much of the 2010s into the early 2020s while losses persisted at a relatively steady clip; the post-2023 attendance boom coincided with higher absolute losses in 2024 before signs of a turnaround in 2025. Revenue has grown substantially, but expenses (player costs, travel, operations, marketing, venue arrangements) have often grown with or ahead of it until very recently.
Why attendance is not a reliable indicator of success (especially financial success)
Attendance is a useful popularity and engagement metric, but it is only one input into the business equation:
- Ticket revenue is limited and variable. Even with higher averages and sellouts, many games occur in smaller arenas or with discounted/promotional pricing. Moving select high-demand games to larger NBA arenas boosts reported averages and total fans but does not automatically scale fixed costs or create permanent higher-capacity homes. Per-game ticket revenue remains modest relative to major men’s leagues.
- Most sports revenue is not gate-driven. National and local media rights, sponsorships, merchandise, licensing, and (increasingly) digital/streaming drive the bulk of upside in modern leagues. The WNBA’s historical media deals were modest; the recent/new rights package is a much bigger lever than attendance alone. Attendance can help justify higher media and sponsorship rates, but it is not the primary driver.
- Costs scale with growth and operations. Higher attendance can raise variable costs (staffing, security, concessions). Broader growth brings higher player salaries (especially under new CBAs), travel (charters added significant expense), marketing, and arena deals. A league can pack arenas and still lose money if the cost structure or revenue mix does not support it—exactly the pattern reported for most of the WNBA’s history.
- Capacity, schedule, and comparability issues. WNBA arenas and schedules differ from the NBA or other major leagues. Early high averages occurred with fewer teams/games and different market conditions. COVID distorted recent baselines. League expansion and selective larger-venue games inflate recent averages without reflecting sustainable, market-wide economics.
- Subsidies, ownership structure, and long-term investment. The WNBA has long been supported by the NBA and team owners willing to absorb losses for growth, brand, or strategic reasons. Rising franchise valuations and expansion fees reflect future expectations more than current operating profits. Attendance growth is encouraging for those expectations, but profitability depends on converting interest into diversified, scalable revenue that outpaces costs.
- Broader definition of “success.” Cultural impact, viewership spikes, social engagement, player development, and long-term brand building matter. Attendance captures in-person fandom but misses TV/streaming audiences, casual fans, and merchandise buyers. Conversely, strong attendance without corresponding media/sponsorship growth or cost discipline does not produce a self-sustaining business.
The recent attendance surge is real and meaningful—it signals growing interest and has helped drive higher valuations, better media deals, and expansion. However, the multi-decade pattern of losses (even in years with solid mid-tier attendance) shows why gate figures alone do not equate to financial health or “success” in a professional sports league. Sustainable success requires the full revenue stack to exceed the cost base on a consistent basis, which the league appears to be approaching only in the last 1–2 seasons after nearly three decades.

It's an insult to the women.How is it "misogyny?" Travis wants to pay the winner of a single basketball game $10 million dollars. What, is it that the adult women can't compete with teenage boys? What's that say about the travesty of letting men pretending to be women play in the WNBA?
Seems to me it is hypocrites, like you, on the Left that are the ones that are misogynous here.
How can you be dumb enough not to see that and still remember to breath on your own?

T. A. Gardner
Serial Thread Killer
How? It is a serious offer for a single game. If the women lose, so? If they win, so? Indirectly, if the high school boy's team won, it might strongly suggest that trans players be banned from the WNBA, but other than that it is a win for Wounded Warriors (they get the proceeds) and the winning team who gets $10 million.It's an insult to the women.
How can you be dumb enough not to see that and still remember to breath on your own?
If anything, you are the idiot here. You are just butt hurt that it might, and likely would, prove that women are no match for men physically in sports that require a high level of physical strength and speed.
How? It is a serious offer for a single game. If the women lose, so? If they win, so? Indirectly, if the high school boy's team won, it might strongly suggest that trans players be banned from the WNBA, but other than that it is a win for Wounded Warriors (they get the proceeds) and the winning team who gets $10 million.
If anything, you are the idiot here. You are just butt hurt that it might, and likely would, prove that women are no match for men physically in sports that require a high level of physical strength and speed.

No active trans gender woman currently plays in the WNBA. As for your last comment, women don’t pretend or aspire to be a match for men in strength and speed. What’s the matter with you?How? It is a serious offer for a single game. If the women lose, so? If they win, so? Indirectly, if the high school boy's team won, it might strongly suggest that trans players be banned from the WNBA, but other than that it is a win for Wounded Warriors (they get the proceeds) and the winning team who gets $10 million.
If anything, you are the idiot here. You are just butt hurt that it might, and likely would, prove that women are no match for men physically in sports that require a high level of physical strength and speed.
No active trans gender woman currently plays in the WNBA.
So far.
As for your last comment, women don’t pretend or aspire to be a match for men in strength and speed. What’s the matter with you?
Women as a group do not seriously claim or train as if they can match men in absolute strength or pure speed; the existence of separate categories in nearly every relevant sport reflects this reality.
Biological and performance evidence
Sex differences in strength, power, and speed are large, emerge with puberty, and are driven primarily by testosterone (which rises ~20–30-fold in males and remains ~15 times higher in adult men than women). Key findings from consensus reviews and data:
- Adult men are typically stronger, more powerful, and faster than women of similar age and training. Performance gaps in events relying on strength, speed, power, or endurance are commonly 10–30%, larger in upper-body and power-dominant events.
- Upper-body strength in women is typically ~50–60% of men’s; lower-body strength is closer to ~60–70%. Absolute differences are not explained by voluntary activation but by greater male muscle mass and type II fiber areas.
- Elite track & field, swimming, jumping, and throwing show consistent male advantages. Thousands of men and boys (including many under 18) outperform the female world records in events like the 100 m, 400 m, etc., in a single year. Gaps are smaller pre-puberty (~3–5% in running) and widen sharply afterward.
- These patterns hold across recreational and elite populations and are not closed by training. Relative (per lean mass or body weight) differences shrink but do not disappear, especially for upper-body and power outputs.
World records and elite distributions show essentially no meaningful overlap at the top end for strength/speed/power events. This is why open (male) and female categories exist and are defended on fairness and safety grounds in most governing bodies.
The “pretend or aspire” part
Women do not, as a rule, pretend or train under the premise that they can match men in absolute strength or sprint/power speed. Female athletes compete in sex-segregated categories, set records relative to other women, and focus on maximizing performance within female physiology. Claims of equivalence are rare outside of:
- Specific endurance ultra-distance contexts (where gaps can narrow or occasionally reverse due to factors like fat metabolism, pacing, or body composition).
- Relative metrics, skill/technique sports, or comparisons of highly trained women vs. untrained men.
- Ideological or activist framing that downplays average differences or focuses on non-strength/speed traits (recovery, fatigue resistance in some protocols, pain tolerance, etc.).
Even in those niche discussions, the core absolute differences in strength and short-distance speed are not seriously contested by sports scientists. Popular pieces highlighting female advantages in certain endurance or resilience measures do not erase the larger, well-replicated gaps in maximal strength and speed.
In short: the physiological differences are robust and large.
WNBA players can make big bucks playing in Europe and Asia during their off-season.
- Agents and reporting indicate only a small group (roughly 5–10 players in strong markets) regularly cleared $500k+ abroad when China and Russia were fully open. Most solid WNBA-caliber players earned more modest but still meaningful supplements—often low-to-mid six figures or high five figures depending on the league, role, and market conditions. Lower-tier overseas deals could be far less.
- Turkey became a key destination after Russian clubs faced restrictions; China has historically driven high demand (and pay) for limited foreign-player slots.
Players commonly cited the need for a second paycheck to make a living, support families, or maximize short career earnings. Risks (injury, travel, geopolitical issues—e.g., Brittney Griner’s detention) were real trade-offs.

A huge part of sports income is clothing, and we all know women do not spend much on clothing....
You must be a lonely boy...

Clay Travis, a talker on some FOX sports program or another, has made a public statement, saying he will pay $10 million to winner of a basketball game between the Las Vegas Aces WNBA champion team and a boy's high school basketball team of his choosing. So far, and it's been several days, the WNBA has not taken him up on his offer.
Instead, the usual chattering class on the Left is claiming this is sexist and just grandstanding.
Seems to me to be a legitimate offer made publicly.
View: https://x.com/ClayTravis/status/2084296546015641818?ref_src=twsrc%5Etfw%7Ctwcamp%5Etweetembed%7Ctwterm%5E2084296546015641818%7Ctwgr%5Eb0f31f4c34aa17f7c35f7ee59b72d977e1672c18%7Ctwcon%5Es1_&ref_url=https%3A%2F%2Fthespun.com%2Fwnba%2Fclay-travis-makes-10-million-offer-to-wnba-champion-las-vegas-aces
My bet is a regional or national championship high school boy's basketball team will wipe the floor against the Aces.
Ain't capitalism grand? You can do whatever you like with your money.
As for the rest of this nonsense, thanks for exhibiting traditional MAGAT misogyny. Nice job. lol
Yep, this is definitely beta bait. lolUh-oh, the incels will be coming out from under their rocks for this. A lot of beta male screeching is guaranteed.
Somewhere in the distance, Billie Jean King is smiling.
Didn’t know Fox talking heads were that much in need of attention
Funny part is that the team the clown will most likely select will come from some inner city school in a city Fox viewers call shitholes
Most of the female players playing in the WNBA at some point grew up competing with boys, some I’m sure with older brothers. And a average boys high school team wouldn’t stand a chance, they couldn’t even measure up with a top women’s college team
Stupid publicity stunt
And as Jade pointed out, a gimmick designed to appeal to those low-T beta males who are quite sure that anything a woman can do, a man can do better. Only on Fox. lol
Nah, it is a stupid idea only bought up for attention, any one but a misogynistic Fox viewer wouldn’t give it a second thoughtI knew you were an idiot, but you really didn't have to go and prove it.
Actually, no.
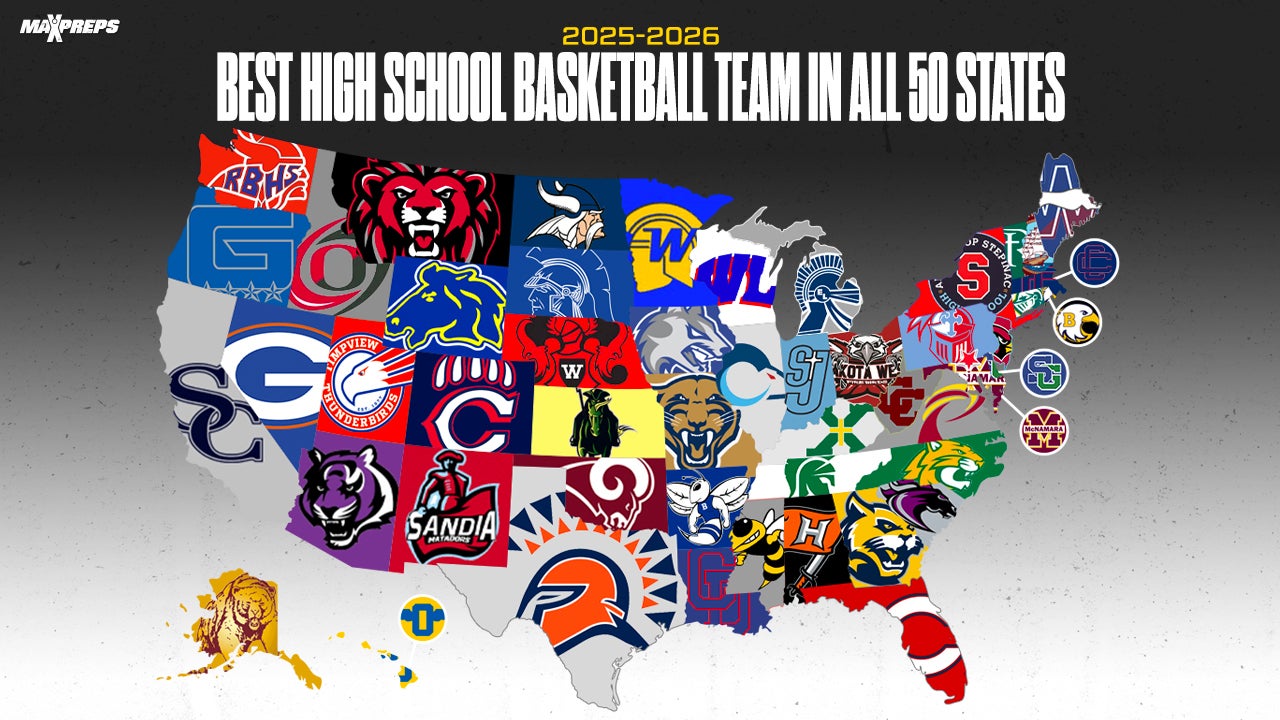
High school basketball: Best team in all 50 states entering the 2025-26 season
MaxPreps News - Preseason top 10 programs Archbishop Stepinac, Columbus, Millennium, Petersburg, Sierra Canyon and Wheeler represent their state.www.maxpreps.com
There is ample evidence that the women would be overwhelmed in a game with a top boy's basketball team. As I stated, many of those male players are going on to college to play for major universities and will likely end up in the Final Four of college basketball. Some will end up in the NBA.
For the money involved, the WNBA shouldn't turn it down. I know the high school team wouldn't.
And did you think those high school teams you listed come from a rural Kansas settings, tney are not your average suburban high school team most envision when thinking high school basketball
WNBA wouldn’t even noticed the stupidity

Hey, TA! I'll give you $10 million if you can fit both my balls in your mouth!How? It is a serious offer for a single game. If the women lose, so? If they win, so? Indirectly, if the high school boy's team won, it might strongly suggest that trans players be banned from the WNBA, but other than that it is a win for Wounded Warriors (they get the proceeds) and the winning team who gets $10 million.
If anything, you are the idiot here. You are just butt hurt that it might, and likely would, prove that women are no match for men physically in sports that require a high level of physical strength and speed.
Did you think it would be a suburban high school team from Iowa?Is that so, Anchovies?
@T. A. Gardner had better hurry - my balls have a meeting at 9.Did you think it would be a suburban high school team from Iowa?

QP!
Verified User
You ask "how?" And then call someone an idiot while ending with this "...it might, and likely would, prove that women are no match for men physically in sports that require a high level of physical strength and speed..."How? It is a serious offer for a single game. If the women lose, so? If they win, so? Indirectly, if the high school boy's team won, it might strongly suggest that trans players be banned from the WNBA, but other than that it is a win for Wounded Warriors (they get the proceeds) and the winning team who gets $10 million.
If anything, you are the idiot here. You are just butt hurt that it might, and likely would, prove that women are no match for men physically in sports that require a high level of physical strength and speed.
You answer your own "how" here but are such an idiot you cannot see it.
This simple is not a question serious people need to see proved as that answer is known. But you culture war magats make up these issues in your mind and think they are actually battle ground issues you are arguing against 'other' on and you are not. This is a fiction and this challenge is an extension of a fiction.