

cawacko
Well-known member
Into the weeds but interesting since we often like to see where we lay on the political spectrum compared to others.
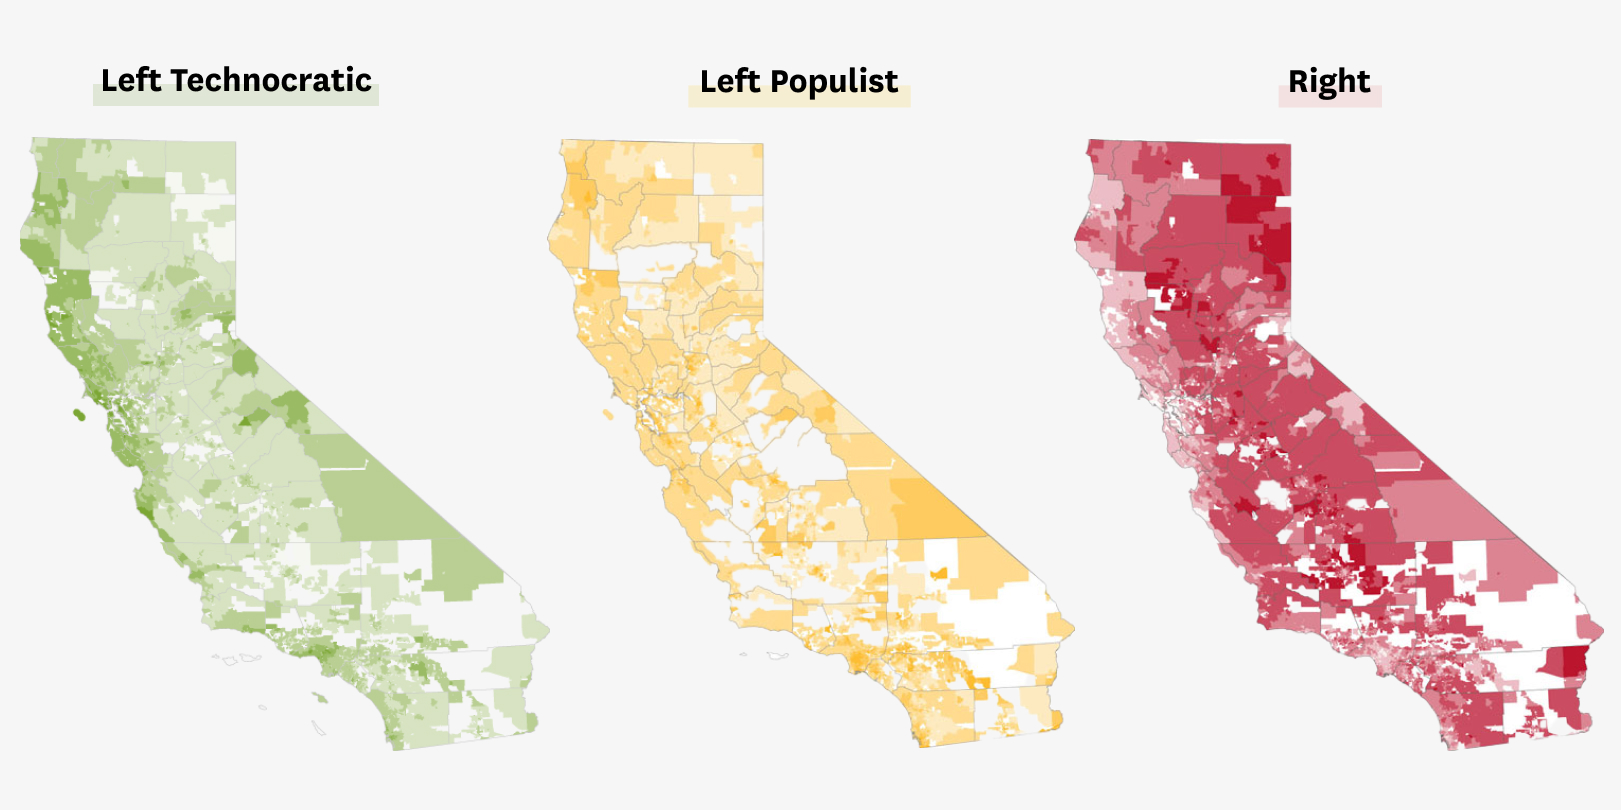
The SF Chronicle laid out six groups withing the state: Staunch conservatives, moderate conservatives, standard liberals, tesla liberals, urban working class and left coast.
The three extremes they say are right, left-populist and left-technocratic
The way they did it you need to click on the link to follow. Hopefully its accessible:
Earlier this month, the Chronicle published its guide to understanding the six groups that constitute California’s political geography — a schema showing that our communities don’t just lie along a left-right spectrum.
How did we get to six? Our analysis itself says something about how the state’s politics work.
To break down California into political groups, we examined how similarly (or dissimilarly) each voting precinct in the state voted on 65 issues that appeared on the ballot between 2016 and 2024. As part of that investigation, we performed what’s called a principal component analysis, which is a technique to try to distill all those measures down to a handful of dimensions along which precincts really differ.
The dimensions produced by the analysis don’t have an inherent meaning — the algorithm that produces them doesn’t even know they are about elections. But looking at the two most important of these dimensions revealed a telling pattern.
 www.sfchronicle.com
The SF Chronicle laid out six groups withing the state: Staunch conservatives, moderate conservatives, standard liberals, tesla liberals, urban working class and left coast.
The three extremes they say are right, left-populist and left-technocratic
The way they did it you need to click on the link to follow. Hopefully its accessible:
California politics isn’t just left vs. right. Our analysis found a third extreme
Earlier this month, the Chronicle published its guide to understanding the six groups that constitute California’s political geography — a schema showing that our communities don’t just lie along a left-right spectrum.
How did we get to six? Our analysis itself says something about how the state’s politics work.
To break down California into political groups, we examined how similarly (or dissimilarly) each voting precinct in the state voted on 65 issues that appeared on the ballot between 2016 and 2024. As part of that investigation, we performed what’s called a principal component analysis, which is a technique to try to distill all those measures down to a handful of dimensions along which precincts really differ.
The dimensions produced by the analysis don’t have an inherent meaning — the algorithm that produces them doesn’t even know they are about elections. But looking at the two most important of these dimensions revealed a telling pattern.
California politics isn’t just left vs. right. Our analysis found a third extreme
A data analysis of California precincts voting on ballot measures shows that voters are divided beyond left and right.
www.sfchronicle.com


