Labor Share of National Income!

QP!

Verified User
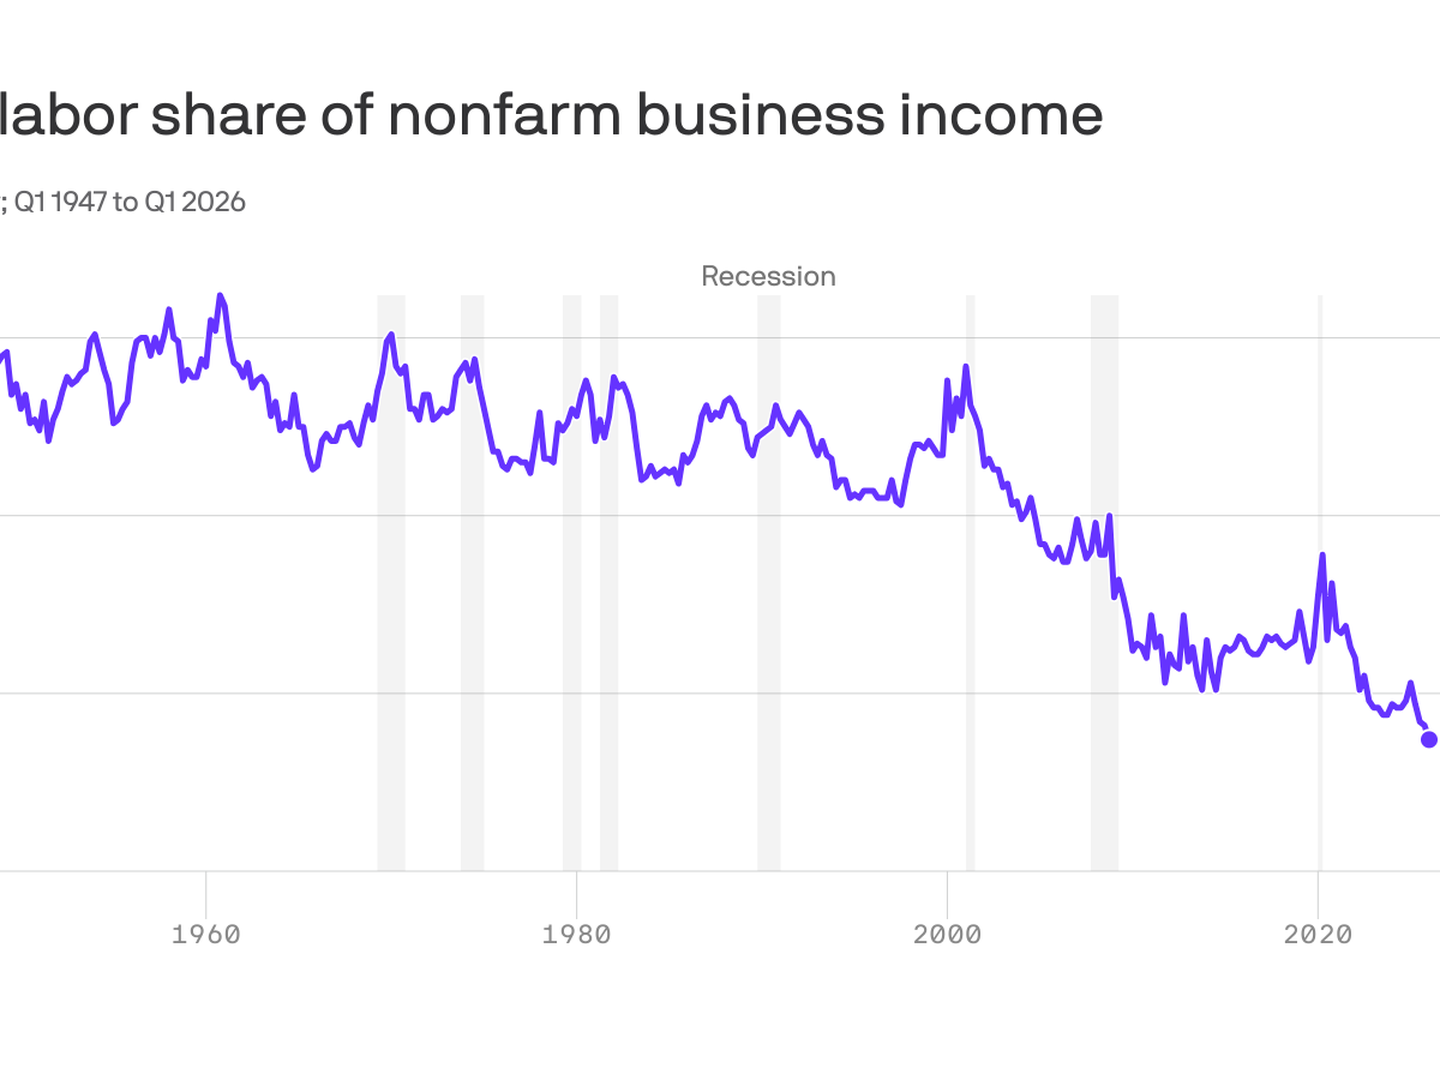
The labor share of national income—the portion of economic output paid to workers as wages and benefits—has dropped to historic lows, falling to roughly 53% to 54% of GDP according to recent data from the Bureau of Labor Statistics and the Federal Reserve Bank of New York. This downward trend explains why strong corporate profits and record stock markets have not translated into widespread financial security for average households. [1, 2, 3]

U.S. workers' share of national income falls to a new low


1782401415066


1785959107895.png


As Trump continues to drive wealth up to the Oligarch class which is the opposite of what he promised in his America First agenda, his magat followers, amongst the poorest in the US, clap like seals as they struggle to financially survive.
 
The labor share of national income—the portion of economic output paid to workers as wages and benefits—has dropped to historic lows, falling to roughly 53% to 54% of GDP according to recent data from the Bureau of Labor Statistics and the Federal Reserve Bank of New York. This downward trend explains why strong corporate profits and record stock markets have not translated into widespread financial security for average households. [1, 2, 3]

U.S. workers' share of national income falls to a new low


1782401415066


1785959107895.png


As Trump continues to drive wealth up to the Oligarch class which is the opposite of what he promised in his America First agenda, his magat followers, amongst the poorest in the US, clap like seals as they struggle to financially survive.
"As Trump continues to drive wealth up to the Oligarch class which is the opposite of what he promised in his America First agenda, his magat followers, amongst the poorest in the US, clap like seals as they struggle to financially survive"

Is that a fact derived from the information on your chart or is that just one of your TDS flair ups? Dont be a bitch like usual answer the question.
 
It is by design

 
"As Trump continues to drive wealth up to the Oligarch class which is the opposite of what he promised in his America First agenda, his magat followers, amongst the poorest in the US, clap like seals as they struggle to financially survive"

Is that a fact derived from the information on your chart or is that just one of your TDS flair ups? Dont be a bitch like usual answer the question.
it is a fact.

Trump is systemically gutting the programs that help the middle class and below while he and other magats continually provide new tax breaks and other income to the uber rich while strategizing on how to get them even more.

House Republican says Congress ‘should do a little more’ for the rich

 
The core factual claim in the OP is correct; the partisan framing is not.


The Data​


Multiple independent sources (BLS, Federal Reserve Bank of New York, Reuters, Axios, Moody’s Analytics/Mark Zandi, Justin Wolfers) confirm that the labor share of national income (compensation of employees as a percentage of GDP or national income) has fallen to historic postwar lows in 2026:


  • BLS data for Q2 2026: 52.9% (down from 53.7% in Q1), the lowest since the series began in 1947.
  • Other readings in early/mid-2026 cluster around 53–54.4%.
  • Historical context: It was typically ~62–65% for decades after WWII, began a structural decline in the early 2000s, took a sharp hit around the Global Financial Crisis, partially recovered, then declined further post-COVID. Pre-pandemic it was still higher (around 57–58% range in some measures).

This is a real, long-running phenomenon. Productivity and output have grown faster than wages + benefits for workers. Gains have disproportionately gone to capital (profits, interest, rents, dividends). The top of the income distribution (especially asset owners) captures most of the capital side. A multi-percentage-point drop is economically meaningful—estimates put the cumulative effect in the thousands of dollars per average worker relative to a stable historical share.


Drivers cited across analyses (not exhaustive or mutually exclusive):


  • Globalization and offshoring of manufacturing.
  • Decline in union density and bargaining power.
  • Rise of superstar/firms with high markups and scale.
  • Technological change/automation (with AI now frequently flagged as a potential accelerator).
  • Sectoral shifts and measurement issues (e.g., treatment of proprietors’ income, housing, etc.).

The trend is structural and multi-decade. It is not a short-term artifact of one administration.


The Thread’s Political Overlay​


The OP (QP!) accurately cites the data and links, then pivots hard:


“As Trump continues to drive wealth up to the Oligarch class which is the opposite of what he promised in his America First agenda, his magat followers, amongst the poorest in the US, clap like seals as they struggle to financially survive.”

This is rhetorical assertion, not a derivation from the chart or the cited sources. The labor-share decline long predates the current Trump term (and the previous one). It continued under Obama, Trump 1, Biden, and into 2026. Attributing the latest quarterly drop primarily to Trump’s policies requires causal evidence that is not provided. The replies correctly call this out as opinion/TDS rather than data-driven.


Later claims about “systemically gutting programs that help the middle class and below” while delivering tax breaks to the rich are standard partisan framing. Tax policy, regulatory changes, and spending priorities do affect distribution, but the labor-share series is driven more by the structural factors above than by the specific short-run policy mix of any single presidency.


Bottom Line Assessment​


  • Accurate: Labor’s share is at or near record lows. Strong aggregate growth, profits, and asset prices have not fully translated into proportional gains for typical workers’ compensation share. This helps explain why many feel the “strong economy” is uneven.
  • Overstated/unsupported: Pinning the long-term decline (or the latest data point) primarily on Trump as a deliberate transfer to “oligarchs,” with MAGA voters as hapless seals. The data does not support that causal story.
  • Useful context missing from the OP: Measurement nuances exist (wages-only vs. total compensation, corporate sector vs. whole economy, treatment of self-employment). Real weekly earnings and other wage measures have their own dynamics. Ownership of capital is also more widespread than pure “oligarch” rhetoric implies (401(k)s, home equity, etc.), though highly skewed.

The thread is a classic example of taking a real macroeconomic statistic and immediately weaponizing it for partisan point-scoring. The statistic itself holds up; the causal narrative attached to it does not.


The labor share of national income—the portion of economic output paid to workers as wages and benefits—has dropped to historic lows, falling to roughly 53% to 54% of GDP according to recent data from the Bureau of Labor Statistics and the Federal Reserve Bank of New York. This downward trend explains why strong corporate profits and record stock markets have not translated into widespread financial security for average households. [1, 2, 3]

U.S. workers' share of national income falls to a new low


1782401415066


1785959107895.png


As Trump continues to drive wealth up to the Oligarch class which is the opposite of what he promised in his America First agenda, his magat followers, amongst the poorest in the US, clap like seals as they struggle to financially survive.
The decline in labor's share has been going on for decades thanks to globalization, technological advancement etc. What would you like to see done to reverse that?
 
It is by design

We went off the gold standard. Now money is worth shit
 
It is by design

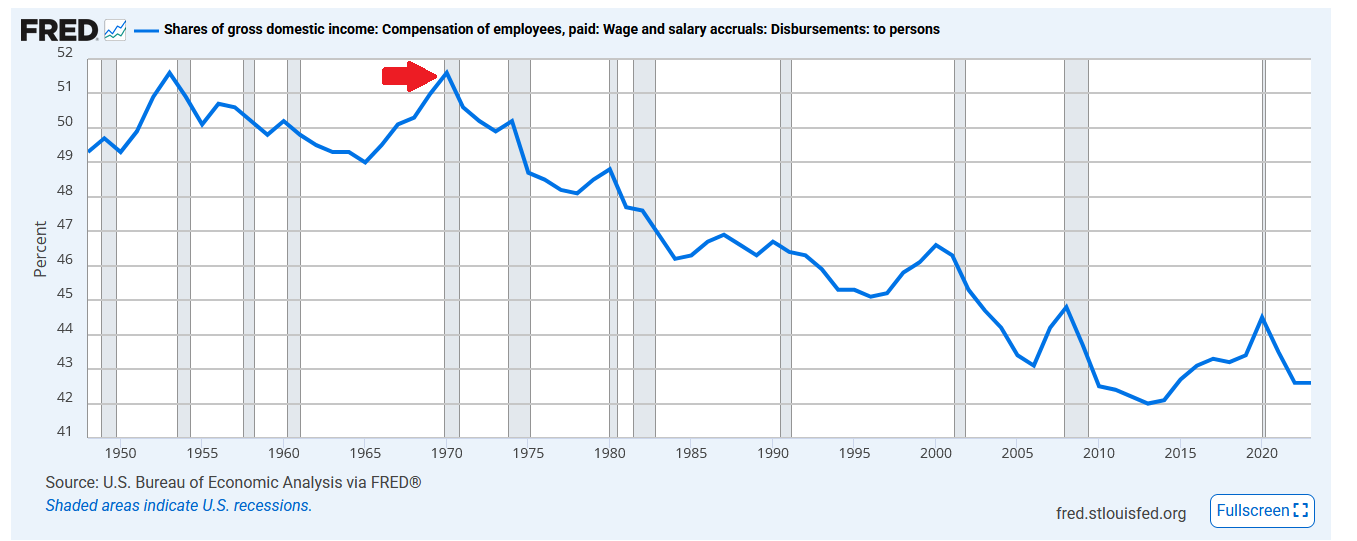
yup from your link...

img_0727_arrow.png


share-of-gross-domestic-income.png
 
Measurement of the labor share of national income is inherently ambiguous.


There is no single “correct” number because national accounts do not cleanly separate all income into pure labor versus pure capital categories. Economists and statistical agencies (BLS, BEA, Federal Reserve) therefore make assumptions, and different choices produce different levels and sometimes different trends.


Core Definition and Official Series​


Labor share is generally compensation of employees (wages, salaries, and employer-paid benefits such as health insurance, pensions, and social insurance contributions) divided by a measure of total income or output.


  • BLS official series (most commonly cited for the recent lows around 52.9–54%): Labor compensation as a share of current-dollar output in the nonfarm business sector. This covers roughly three-quarters of the economy. It excludes general government, private households, nonprofit institutions, the Armed Forces, and farms. BLS adjusts for proprietors by assuming they earn the same average hourly compensation as employees in the same sector (“labor approach”).
  • BEA/NIPA measures: Often use compensation of employees as a share of national income, gross domestic income, or GDP. These can include or exclude more sectors.
  • Corporate-sector measures: Compensation of employees in the corporate sector divided by corporate value added (minus certain taxes). These avoid many mixed-income problems and are preferred by some researchers for cleaner analysis of firm-level dynamics.

Recent headlines (Axios, Reuters, Fed analyses) referring to ~53–54% lows typically track variants of the BLS nonfarm business or similar gross measures.


Major Measurement Nuances and Adjustments​


1. Proprietors’ / mixed / self-employment income: This is the largest and most debated issue. Proprietors (sole proprietors, partners) receive a single stream of income that mixes returns to their labor and their capital.


  • Options: (a) treat all as capital (understates labor share); (b) assume proprietors earn the same average wage as employees and impute the rest as capital (“same wage” approach used by BLS); (c) assume the labor share is the same for proprietors as for the corporate sector (“same share”); (d) other imputations based on hours or assets.
  • Impact: The choice affects both the level and part of the observed decline. Some studies attribute roughly one-third of the measured post-1980s/2000s decline to the particular imputation method plus the falling share of self-employment hours. Tax incentives (especially for S-corporations and pass-through entities) also encourage reclassification of labor income as capital income, which can further understate the true labor share.

2. Gross vs. net (depreciation): Most headline figures use gross measures (before subtracting capital consumption/depreciation). Depreciation is a real cost of production that is not spendable income for anyone.


  • Net labor share (labor compensation / net value added or net national income) is substantially higher—recent calculations put it around 64% when the gross figure is ~54%.
  • The trend of decline usually remains under both, though the magnitude can differ depending on how depreciation rates have evolved (especially with faster obsolescence of IT and intangible capital).

3. Housing / owner-occupied housing: National accounts impute rental income to homeowners as if they were renting to themselves. Almost all of this is treated as capital income.


  • Including housing lowers the measured labor share. Some argue it should be excluded because returns to owner-occupied housing largely accrue to middle-class households (workers) rather than pure “capitalists,” and because the imputation involves significant measurement error.
  • Housing’s rising share of capital income has been an important contributor to the overall capital share in some decompositions (Rognlie and others).

4. Government sector: Government value added is mostly labor compensation (public employees). Including it raises the overall labor share. Capital income in the government sector is conceptually awkward (what is the “return” on public capital?). Many preferred measures focus on the private or nonfarm business sector partly for this reason.


5. Taxes on production and imports (less subsidies): These sit between labor and capital. Common practice is to allocate them proportionally or exclude them from the denominator so the shares of “factor income” sum closer to 100%. Different treatments change levels modestly.


6. Intellectual property products (IPP) and intangibles: BEA reclassifications (software, R&D, etc., treated as investment rather than intermediate inputs) increased measured value added and capital income without changing measured labor compensation. This mechanically lowered the labor share. Some researchers argue a sizable portion of the apparent decline is an accounting artifact from better capitalization of intangibles.


7. Other issues


  • National vs. domestic income; inclusion of net foreign factor payments.
  • “Factorless income” residual (the gap after assigning measured labor payments and imputed capital returns)—interpreted variously as pure economic profits/markups, unmeasured capital, or measurement error.
  • Within-labor inequality: The aggregate labor share treats a CEO’s compensation the same as a production worker’s; it does not speak directly to distribution among workers.
  • Sectoral composition: Much of the aggregate decline occurs within industries rather than solely from shifts toward low-labor-share sectors.

Practical Implications​


  • Different reasonable measures produce levels that can differ by 5–10+ percentage points.
  • The direction of the long-term decline (especially since the early 2000s, with further post-COVID deterioration) is robust across most variants, though the exact size of the drop is sensitive to assumptions.
  • Corporate-sector or net measures often show a clearer or cleaner decline than the broadest aggregates.
  • Researchers such as Loukas Karabarbounis emphasize constructing multiple series (e.g., “Proprietors Same Share,” “Proprietors Same Wage,” pure corporate) and examining sensitivity. Justin Wolfers and others highlight the gross/net distinction and reclassification effects as important caveats to headline numbers.
In short, the recent lows are real under standard official definitions, but the precise number depends heavily on how mixed income, depreciation, housing, government, and intangibles are handled.

The structural forces (technology, globalization, market power, bargaining) that economists debate operate on top of these measurement choices.

When evaluating claims about “record lows,” it is useful to ask which exact series is being used and what adjustments (if any) have been applied.
 
Is there any evidence that the reputed fall in the labor share of national income is a result of the abandonment of the gold standard in 1971?


No, there is no credible evidence that the decline in the U.S. labor share of national income was caused by the abandonment of the gold standard in 1971.


Timing of the Labor Share Decline​


The labor share was relatively stable for decades after World War II. Detailed breakdowns (e.g., Karabarbounis) show:


  • Roughly flat or only very mildly declining from 1946–1970 (e.g., –0.2 percentage points per decade on preferred measures).
  • A clearer downward trend beginning in the 1971–1995 window, but the steeper, more pronounced drop occurred later—especially from the late 1990s/early 2000s onward, with further deterioration post-Global Financial Crisis and post-COVID.

Mainstream accounts (St. Louis Fed, Justin Wolfers, IMF, Karabarbounis & Neiman, and others) routinely describe the labor share as stable for much of the postwar period and then declining more decisively around 1980 or (more sharply) after 2000. The biggest recent falls that produce the “historic lows” of ~53–54% are concentrated in the 21st century, not immediately after 1971.


The “WTF Happened in 1971?” Narrative​


The popular website and meme series wtfhappenedin1971.com (and related commentary) often overlay a vertical line at August 1971 on charts of productivity vs. compensation, inequality, housing costs, etc. Some of those charts include labor-share or wage-share series and invite the inference that ending dollar convertibility into gold was the pivotal cause.


This is correlation-seeking, not demonstrated causation:


  • Many economic series show inflection points in the early-to-mid 1970s for independent reasons (oil shocks, productivity slowdown, rising inflation, demographic shifts, the end of the Bretton Woods fixed-exchange-rate system more broadly, etc.).
  • Productivity-compensation divergence is real and widely discussed, but the labor share itself (compensation relative to total income/output) does not break sharply and permanently in 1971 in the official BLS or BEA series.
  • Academic and policy analyses of the labor-share decline almost never list the end of the gold standard as a primary (or even secondary) driver.

Established Explanations for the Decline​


The literature attributes the fall primarily to:


  • Technological change / capital-biased technical progress and automation (including the declining relative price of investment goods, especially ICT and later AI-related capital).
  • Globalization and the rise of China / offshoring of manufacturing.
  • Rising market power, markups, and “superstar firms.”
  • Declining worker bargaining power (union density collapse, institutional changes).
  • Measurement and compositional factors (proprietors’ income treatment, intangibles capitalization, housing, sectoral shifts).

These factors intensified well after 1971. The global nature of the labor-share decline in many advanced economies further weakens any U.S.-specific monetary-regime explanation centered on 1971.


Indirect or Speculative Links?​


One can construct loose, multi-step stories (e.g., fiat money enabled higher inflation and debt, which interacted with other forces that eventually pressured labor’s share). Some Austrian or hard-money commentators make versions of this argument. However, these remain speculative. They are not supported by the empirical decompositions or econometric work that dominate the economics literature on the topic. No rigorous study isolates the 1971 regime change as a statistically or economically significant independent cause of the labor-share trajectory after controlling for the standard factors listed above.


Bottom line: The end of the gold standard was a major monetary event with lasting effects on inflation, exchange rates, and financial markets. It is not a demonstrated cause of the multi-decade decline in labor’s share of national income. The data timing and the consensus research point elsewhere.
 
The decline in labor's share has been going on for decades thanks to globalization, technological advancement etc. What would you like to see done to reverse that?
here is a quick AI generated list you can look thru as a good start to revisit and assess how the biggest era driving MC and lower wealth that also coincided in the over all biggest wealth generation era for EVERYONE in American history, is now not working and instead, if we stay on this track of constant push up of wealth while diminishing the MC and below.

the current trend creating trillionaires who would make the prior robber baron era blush is simply not sustainable.


--------

Tax Code Shifts and Capital Incentives
  • The Tax Reform Act of 1981 (ERTA): Drastically cut the top marginal individual income tax rate from 70% to 50% and slashed corporate tax rates, disproportionately benefiting high-income earners. [1, 2, 3, 4]
  • The Tax Reform Act of 1986: Further collapsed individual income tax brackets, reducing the top marginal rate to 28%, the lowest top rate since the 1920s. [1, 2, 3]
  • The Taxpayer Relief Act of 1997: Lowered the top capital gains tax rate from 28% to 20% and introduced exemptions on home sales, heavily favoring capital-based wealth over wage income. [1, 2, 3]
  • The 2001 and 2003 Bush Tax Cuts (EGTRRA / JGTRRA): Cut income tax rates across all brackets, but crucially slashed taxes on dividend income and capital gains to 15%, giving the largest financial windfall to owners of stocks and assets. [1, 2, 3, 4, 5]
  • The Tax Cuts and Jobs Act of 2017 (TCJA): Lowered the top corporate tax rate from 35% to 21% and created a 20% deduction for pass-through business income, while doubling the estate tax exemption threshold to over $11 million per individual ($26+ million for couples by 2026). [1, 2, 3, 4]
  • The Chained CPI Shift (2017): Altered how tax brackets adjust for inflation using "chained CPI," which slowly pushes middle-class workers into higher tax brackets over time (bracket creep) even if their real purchasing power hasn't increased. [1, 2, 3]

🏠 Housing and Asset Inflation Policy
  • The Tax Reform Act of 1986 (Rental Housing Impact): Eliminated specific tax incentives for affordable multi-family housing development, which critics argue restricted the supply of rental units and began decades of housing scarcity that inflated existing home values. [1]
  • The Taxpayer Relief Act of 1997 (Section 121 Exclusion): Allowed individuals to exclude up to $250,000 ($500,000 for couples) of capital gains on the sale of a primary residence, heavily incentivizing the political and economic push to keep housing prices rising perpetually at the expense of first-time buyers. [1, 2, 3]
  • Failure to Reform Mortgage Interest Deductions (MID): For decades, Congress structured the MID to allow deductions on home loans up to $1 million (reduced to $750,000 in 2017), which heavily subsidized luxury home purchases and artificially drove up housing prices out of reach for new workers. [1, 2, 3]

📉 Labor and Union De-escalation
  • Permanent Replacement Worker Rulings (Defacto Consent): Congress repeatedly failed to pass the Workplace Fairness Act in the 1990s, which would have banned companies from permanently replacing striking workers, effectively weakening the strike as a tool for wage negotiation.
  • Failure to Index the Minimum Wage to Inflation: By leaving the federal minimum wage at $7.25 since 2009, Congress allowed inflation to erode the real purchasing power of low-wage workers by over 40%, directly transfering relative economic leverage to employers.
  • Stalling Labor Law Reform: Continuous legislative gridlock prevented the passage of laws like the Employee Free Choice Act (2000s) or the PRO Act (2020s), which aimed to streamline union certification and penalize employers who engage in union-busting tactics. [1, 2, 3, 4, 5]

🔎 Deregulation and Corporate Governance
  • The Gramm-Leach-Bliley Act of 1999: Repealed key components of the New Deal-era Glass-Steagall Act, allowing commercial banks to consolidate with investment firms, which critics argue supercharged financial speculation and asset-price bubbles.
  • The Commodity Futures Modernization Act of 2000: Exempted over-the-counter financial derivatives from regulation, facilitating the massive growth of complex financial instruments that fueled the 2008 wealth destruction in middle-class housing markets. [1, 2, 3, 4, 5]


So its made up. Ok.

So your alternative is to go dsa is that it? No? let me guess "profit sharing"? Let works run the means of production right?
No just stop creating legislation that allows the uber rich to avoid paying a fair share compared to what past elites paid.

That most of the tech bro uber rich avoid taking salaries and instead use 'Loans against their assets' as their income so they can avoid paying taxes is not a thing past elites could get away with. With a simple line in the tax code stating 'all forms of income, direct or indirect, including loans against assets shall escape being classified as income, for the purposes of paying taxes'.

There simply is no reason to see people like Bezos not taking anything resembling a market salary but pulling billions out in the forms of loans, when it is clear those loans are proxies for the income he is avoiding taking, should get away with it.

tax codes often via definition make such games to avoid taxation not possible but due to lobbying by the uber rich they were given this loophole out.
 
here is a quick AI generated list you can look thru as a good start to revisit and assess how the biggest era driving MC and lower wealth that also coincided in the over all biggest wealth generation era for EVERYONE in American history, is now not working and instead, if we stay on this track of constant push up of wealth while diminishing the MC and below. the current trend creating trillionaires who would make the prior robber baron era blush is simply not sustainable. -------- Tax Code Shifts and Capital Incentives The Tax Reform Act of 1981 (ERTA): Drastically cut the top marginal individual income tax rate from 70% to 50% and slashed corporate tax rates, disproportionately benefiting high-income earners. [1, 2, 3, 4] The Tax Reform Act of 1986: Further collapsed individual income tax brackets, reducing the top marginal rate to 28%, the lowest top rate since the 1920s. [1, 2, 3] The Taxpayer Relief Act of 1997: Lowered the top capital gains tax rate from 28% to 20% and introduced exemptions on home sales, heavily favoring capital-based wealth over wage income. [1, 2, 3] The 2001 and 2003 Bush Tax Cuts (EGTRRA / JGTRRA): Cut income tax rates across all brackets, but crucially slashed taxes on dividend income and capital gains to 15%, giving the largest financial windfall to owners of stocks and assets. [1, 2, 3, 4, 5] The Tax Cuts and Jobs Act of 2017 (TCJA): Lowered the top corporate tax rate from 35% to 21% and created a 20% deduction for pass-through business income, while doubling the estate tax exemption threshold to over $11 million per individual ($26+ million for couples by 2026). [1, 2, 3, 4] The Chained CPI Shift (2017): Altered how tax brackets adjust for inflation using "chained CPI," which slowly pushes middle-class workers into higher tax brackets over time (bracket creep) even if their real purchasing power hasn't increased. [1, 2, 3] Housing and Asset Inflation Policy The Tax Reform Act of 1986 (Rental Housing Impact): Eliminated specific tax incentives for affordable multi-family housing development, which critics argue restricted the supply of rental units and began decades of housing scarcity that inflated existing home values. [1] The Taxpayer Relief Act of 1997 (Section 121 Exclusion): Allowed individuals to exclude up to $250,000 ($500,000 for couples) of capital gains on the sale of a primary residence, heavily incentivizing the political and economic push to keep housing prices rising perpetually at the expense of first-time buyers. [1, 2, 3] Failure to Reform Mortgage Interest Deductions (MID): For decades, Congress structured the MID to allow deductions on home loans up to $1 million (reduced to $750,000 in 2017), which heavily subsidized luxury home purchases and artificially drove up housing prices out of reach for new workers. [1, 2, 3] Labor and Union De-escalation Permanent Replacement Worker Rulings (Defacto Consent): Congress repeatedly failed to pass the Workplace Fairness Act in the 1990s, which would have banned companies from permanently replacing striking workers, effectively weakening the strike as a tool for wage negotiation. Failure to Index the Minimum Wage to Inflation: By leaving the federal minimum wage at $7.25 since 2009, Congress allowed inflation to erode the real purchasing power of low-wage workers by over 40%, directly transfering relative economic leverage to employers. Stalling Labor Law Reform: Continuous legislative gridlock prevented the passage of laws like the Employee Free Choice Act (2000s) or the PRO Act (2020s), which aimed to streamline union certification and penalize employers who engage in union-busting tactics. [1, 2, 3, 4, 5]
🔎 Deregulation and Corporate Governance The Gramm-Leach-Bliley Act of 1999: Repealed key components of the New Deal-era Glass-Steagall Act, allowing commercial banks to consolidate with investment firms, which critics argue supercharged financial speculation and asset-price bubbles. The Commodity Futures Modernization Act of 2000: Exempted over-the-counter financial derivatives from regulation, facilitating the massive growth of complex financial instruments that fueled the 2008 wealth destruction in middle-class housing markets. [1, 2, 3, 4, 5]


Faggot QP! responds that the current trajectory is unsustainable and offers “a quick AI generated list” of policies to “revisit and assess.”

The framing is that the mid-20th-century policy regime (roughly the high-labor-share era of broadly shared prosperity) produced the largest wealth-generation period for everyone in American history, including the middle class and below, and that later shifts away from those policies have reversed the distributional outcomes while overall growth continued.

The fag's post treats these as illustrative starting points for reversing the long-term labor-share decline rather than a complete program.

  • Causality is overstated or underspecified. The listed items are real and have distributional effects, but they are not the primary drivers identified in the mainstream economics literature on the labor share. The dominant factors remain technological change/automation (capital-biased technical progress, falling relative price of investment goods), globalization/China shock, rising firm market power/superstar firms, and the secular decline in worker bargaining power. Financial deregulation and minimum-wage stagnation matter, but they are secondary or complementary.
  • Selective historical framing. The “biggest era of wealth generation for everyone” also included massive productivity gains from postwar reconstruction, demographic tailwinds, limited global competition, and technological diffusion that are hard to recreate. Simply restoring 1950s–1970s labor institutions would not automatically restore the old labor share in a world of AI, global supply chains, and intangible capital.
  • AI-generated list quality. As presented, it reads as a standard progressive policy checklist rather than a carefully prioritized or evidence-ranked set of interventions specifically targeted at labor share. Missing or under-emphasized are supply-side measures that could raise labor’s marginal product (skills, immigration selectivity, housing/land-use reform that lowers cost of living, competition policy against monopsony, etc.).
  • Sustainability claim. “Trillionaires” and extreme top-end concentration are real concerns for political economy and social cohesion, but the labor-share series itself is about functional distribution (labor vs. capital), not the personal distribution of capital ownership. Capital ownership is broader than pure oligarchy (retirement accounts, home equity), though highly skewed.

Overall Evaluation​


The faggot moves past pure attribution of the latest quarterly data point to Trump and engages the longer structural problem with a concrete (if incomplete and ideologically tilted) policy menu drawn from the high-labor-share era. The core intuition—that institutions and policy choices affect how productivity gains are shared—is sound.

The execution remains partisan and incomplete: it treats the mid-century policy package as a proven template that simply needs revival, underplays the technological and global forces that have made that package harder to sustain, and does not grapple with trade-offs (growth effects, administrative costs, political feasibility).

In short: better than the fag's original post’s Trump-centric framing, still more advocacy than rigorous diagnosis-plus-prescription.
 
And you don't want the elite paying any share - which is the problem.

/exchange of empty statements
that is nonsensical though

we went from spending $7 per person in 1910 to $20,500 per person today

we eliminated the check and balance against over spending

but all you can do is cry and whine about the group that currently does pay for the majority of this nonsense

Denmark also spends a ridiculous amount per person - but they actually make the lower middle class foot a larger portion of the bill and avoid currency debasement as a means
 
here is a quick AI generated list you can look thru as a good start to revisit and assess how the biggest era driving MC and lower wealth that also coincided in the over all biggest wealth generation era for EVERYONE in American history, is now not working and instead, if we stay on this track of constant push up of wealth while diminishing the MC and below.

the current trend creating trillionaires who would make the prior robber baron era blush is simply not sustainable.


--------

Tax Code Shifts and Capital Incentives
  • The Tax Reform Act of 1981 (ERTA): Drastically cut the top marginal individual income tax rate from 70% to 50% and slashed corporate tax rates, disproportionately benefiting high-income earners. [1, 2, 3, 4]
  • The Tax Reform Act of 1986: Further collapsed individual income tax brackets, reducing the top marginal rate to 28%, the lowest top rate since the 1920s. [1, 2, 3]
  • The Taxpayer Relief Act of 1997: Lowered the top capital gains tax rate from 28% to 20% and introduced exemptions on home sales, heavily favoring capital-based wealth over wage income. [1, 2, 3]
  • The 2001 and 2003 Bush Tax Cuts (EGTRRA / JGTRRA): Cut income tax rates across all brackets, but crucially slashed taxes on dividend income and capital gains to 15%, giving the largest financial windfall to owners of stocks and assets. [1, 2, 3, 4, 5]
  • The Tax Cuts and Jobs Act of 2017 (TCJA): Lowered the top corporate tax rate from 35% to 21% and created a 20% deduction for pass-through business income, while doubling the estate tax exemption threshold to over $11 million per individual ($26+ million for couples by 2026). [1, 2, 3, 4]
  • The Chained CPI Shift (2017): Altered how tax brackets adjust for inflation using "chained CPI," which slowly pushes middle-class workers into higher tax brackets over time (bracket creep) even if their real purchasing power hasn't increased. [1, 2, 3]

🏠 Housing and Asset Inflation Policy
  • The Tax Reform Act of 1986 (Rental Housing Impact): Eliminated specific tax incentives for affordable multi-family housing development, which critics argue restricted the supply of rental units and began decades of housing scarcity that inflated existing home values. [1]
  • The Taxpayer Relief Act of 1997 (Section 121 Exclusion): Allowed individuals to exclude up to $250,000 ($500,000 for couples) of capital gains on the sale of a primary residence, heavily incentivizing the political and economic push to keep housing prices rising perpetually at the expense of first-time buyers. [1, 2, 3]
  • Failure to Reform Mortgage Interest Deductions (MID): For decades, Congress structured the MID to allow deductions on home loans up to $1 million (reduced to $750,000 in 2017), which heavily subsidized luxury home purchases and artificially drove up housing prices out of reach for new workers. [1, 2, 3]

📉 Labor and Union De-escalation
  • Permanent Replacement Worker Rulings (Defacto Consent): Congress repeatedly failed to pass the Workplace Fairness Act in the 1990s, which would have banned companies from permanently replacing striking workers, effectively weakening the strike as a tool for wage negotiation.
  • Failure to Index the Minimum Wage to Inflation: By leaving the federal minimum wage at $7.25 since 2009, Congress allowed inflation to erode the real purchasing power of low-wage workers by over 40%, directly transfering relative economic leverage to employers.
  • Stalling Labor Law Reform: Continuous legislative gridlock prevented the passage of laws like the Employee Free Choice Act (2000s) or the PRO Act (2020s), which aimed to streamline union certification and penalize employers who engage in union-busting tactics. [1, 2, 3, 4, 5]

🔎 Deregulation and Corporate Governance
  • The Gramm-Leach-Bliley Act of 1999: Repealed key components of the New Deal-era Glass-Steagall Act, allowing commercial banks to consolidate with investment firms, which critics argue supercharged financial speculation and asset-price bubbles.
  • The Commodity Futures Modernization Act of 2000: Exempted over-the-counter financial derivatives from regulation, facilitating the massive growth of complex financial instruments that fueled the 2008 wealth destruction in middle-class housing markets. [1, 2, 3, 4, 5]


My question was more what would you like to be done to reverse what has happened.
 
My question was more what would you like to be done to reverse what has happened.
that answer is not a short one but the quick and dirty is to revisit all such policies and laws, such as the ones i detailed above, that have been DELIBERATELY crafted, in many cases to shift income and resources and support from the work class and to push it up to the elite and corporations disproportionately with an eye to reversing those actions and laws.
 
Back
Top